ATTENTION PUBLIC SERVANTS: BETA TESTERS WANTED

Know where help is needed most.
Vulnerability Atlas
A dual-platform tool designed to help public servants deploy resources efficiently and help unhoused residents locate them with ease.
What Happens When We Guess Wrong?
why data and lived experience must drive decisions
In 2023, the City of San Diego purchased dozens of “ice fishing tents” as emergency shelter for unhoused residents.
The assumption?
“Ice fishing” meant insulated and warm.
The reality?
These tents were designed for use with an external stove — and included a vent hole on top and no floor.
The result?
Leaks, cold air, rodents, and frustration from the very people the program aimed to help.
This isn’t a failure of intent — it’s a failure of feedback.
Without real-time insights and lived-experience context, even well-funded programs can miss the mark.

How Vulnerability Atlas Prevents This
Combines point-in-time counts, live reporting, and real-time kiosk feedback
Surfaces gaps between what’s deployed and what’s actually needed
Supports smarter, more empathetic decision-making — backed by data, not guesswork
ABOUT US

What Vulnerability Atlas Does

Too often, resources go to the loudest complaints — not the deepest needs.
Vulnerability Atlas changes that by combining:
Verified homeless population data
Reported concerns from Get It Done
Transit accessibility (via SANDAG)
Rent burden and demographic pressure zones
Existing service locations (via 211 SD)
The result? A prioritized, location-specific recommendation engine for where to deploy services like outreach teams, mobile hygiene stations, or mental health support.

Built on the Foundation of
Get It Done
San Diegans already use Get It Done to report encampments, infrastructure issues, and neighborhood concerns.
San Diegans already use Get It Done to report encampments, infrastructure issues, and neighborhood concerns.
Vulnerability Atlas takes this data — along with homelessness counts, demographics, and transit overlays — and turns it into clear, actionable insights.
We bridge the gap between what’s reported, what’s needed, and what’s deployed.
Who It's For
For Public Servants: The Service Deployment Engine
Vulnerability Atlas helps city and county teams make smarter decisions with:
GIS overlays of point-in-time homelessness counts
Live Get It Done reports processed with OXEN.AI (turning messy complaint text into structured data)
Demographic risk indicators like rent burden and age
Transit overlays from SANDAG
Recommendations for what type of service (e.g. mobile clinic, hygiene station, outreach) to deploy — and where
Built for: city departments, dispatchers, outreach teams, nonprofit service coordinators
Bonus: A daily deployment pipeline for quick operational decisions
For Unhoused Residents:
The Public-Facing Kiosk
The Vulnerability Atlas Kiosk Interface is a touchscreen system designed for public use — no smartphone required.
Features include:
A simple map-based interface to find nearby shelters, showers, food, healthcare, and legal services
Transit routes and walkable options
Real-time updates when resources change
ADA-friendly design for maximum accessibility
📍 Deployed in libraries, shelters, and community centers
🧭 Helps residents navigate the system without needing to “know the system”
How It Works

MAP THE NEED
See concentrations of reports, unsheltered populations, and underserved neighborhoods.

ANALYZE BARRIERS
Overlay public transit gaps, shelter availability, and demographic stressors.

RECOMMENDED ACTION
Get location-specific suggestions for the most effective intervention types — backed by data.
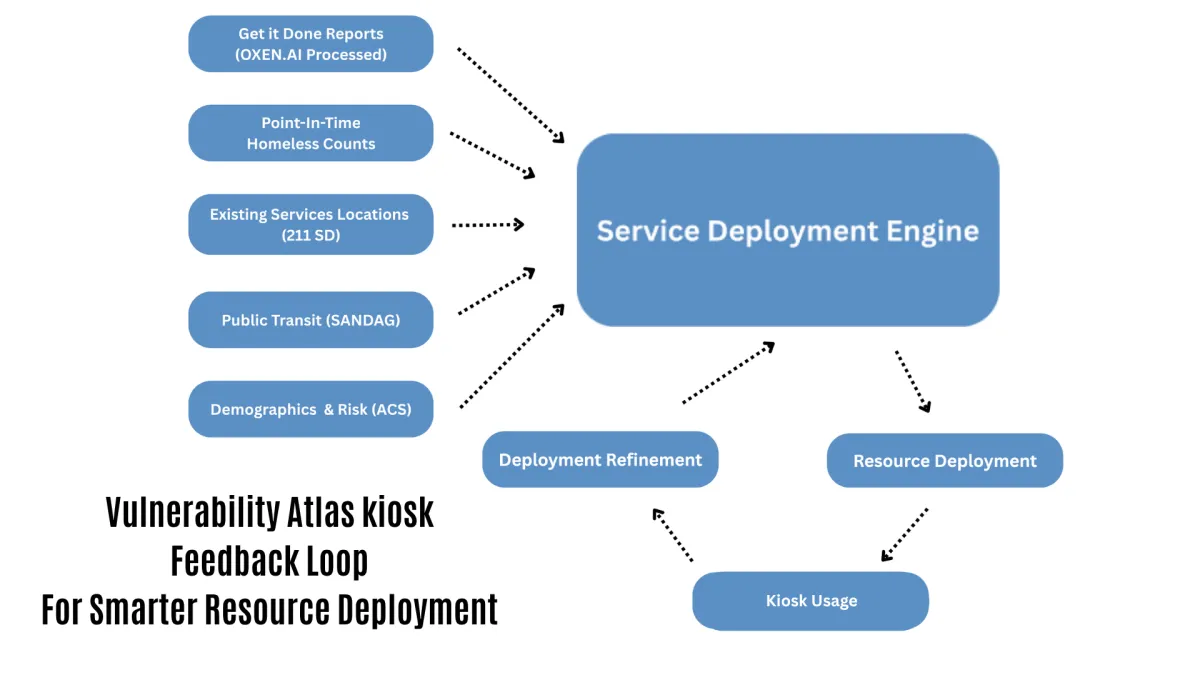
Kiosk Usage Improves
Data-Driven Deployment Decisions
Every time someone searches for a shelter, looks up a mobile clinic, or checks transit options on a Vulnerability Atlas kiosk, that activity is logged (anonymously) and fed back into the Service Deployment Engine.
Over time, this helps identify:
High-demand services that may be missing in certain regions
Mismatch between availability and need (e.g., areas where people look for showers but none exist nearby)
Emerging patterns based on time of day, weather, or event-driven spikes
📊 It’s not just a tool for users — it’s a feedback signal for the system.
By combining public reports, official datasets, and real-time kiosk usage trends, Vulnerability Atlas continuously evolves — making smarter, more empathetic recommendations as it learns.
Why This Works

DATA-INFORMED
Combines official counts + real-time community input

HUMAN-CENTERED
Designed for both decision-makers and service seekers

SCALABLE
Can be customized for other counties or cities

ACTIONABLE
No fluff. Just relevant recommendations and wayfinding
Our Team

Jay Giang

Caden Stewart

Stephen Parker

Pooja Bala Nehru

Nadia Urbina

Bea Bautista
OUR EXPERIENCE


Are You a Public Servant?
Test It In The Field
As part of Hackfrontier, we're piloting Vulnerability Atlas with live data, prototype models, and working kiosk UI.
Join the pilot, shape the future, and help turn community feedback into direct action.